
Despite improvement in official data, experts call for greater transparency in monitoring and a nuanced approach to tackling pollution

Air quality levels displayed on a digital board near Chhatrapati Shivaji Maharaj Terminus on Monday. Pic/Ashish Raje
As Mumbai continues to grapple with air pollution, especially during the winter months, the debate persists—what do the air quality monitors truly reflect, and what more needs to be done to ensure cleaner, healthier air for all? While the city’s toxic air worsens especially during winter months due to weather conditions, recent analysis of Central Pollution Control Board (CPCB) data suggests that the issue may be more localised rather than uniform across the city.
ADVERTISEMENT
To explore this further, mid-day spoke to various stakeholders including citizens, activists, environmentalists, and pulmonologists, to understand their perspectives on the issue. A comprehensive five-year analysis of winter air quality data (2020-2025) released earlier this month by NGO Waatavaran Foundation has shown a substantial improvement in air quality parameters, with a remarkable increase in the number of ‘good’ and ‘satisfactory’ air quality days. However, as the numbers on monitors paint an optimistic picture, citizens and experts on the ground present a contrasting reality, pointing out persistent pollution woes and localised challenges.
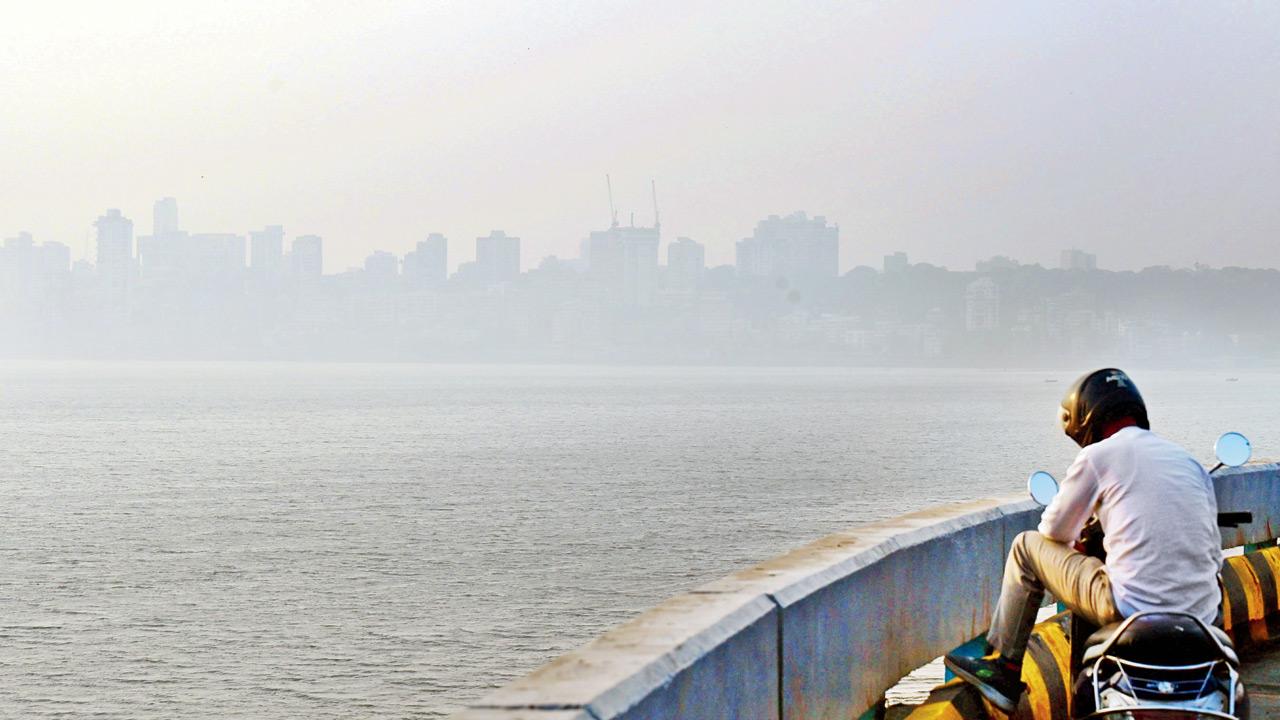
A haze cover at Marine Drive on January 13. File Pic/Shadab Khan
Waatavaran data analysis reveals that the combined percentage of good and satisfactory air quality days has increased by 24 percentage points, from 36 per cent in the winter of 2020-21 to 60 per cent in 2024-25. Notably, the number of good air quality days has doubled from 9 per cent to 18 per cent over the five-year period. The study also indicates a significant reduction in poor and very poor air quality days, with poor air quality days decreasing from 18 per cent to 7 per cent and very poor days dropping from 14 per cent to just 2 per cent.
“The data presents an encouraging trend in our air quality parameters,” says Mohsinkhan Pathan, senior project associate, Waatavaran Foundation. “We’ve observed a significant drop in pollution levels, thanks to sustained efforts in air quality management, stricter regulations, and growing awareness.”
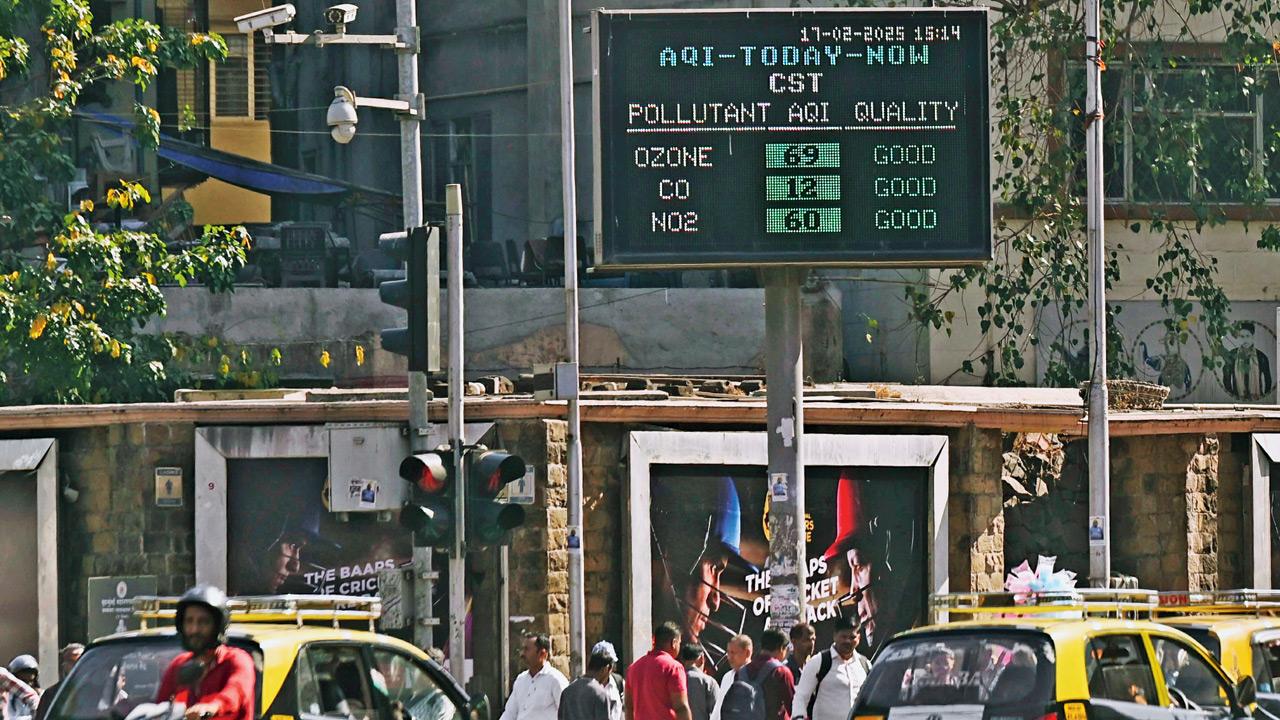
Air quality levels displayed near CSMT on Monday. Pic/Ashish Raje
Despite improvements in official data, citizens and experts call for greater transparency in monitoring and a more nuanced approach to tackling pollution. “Numbers alone won’t clear the air,” said Pathan. “While it’s crucial to acknowledge progress, we must also address the concerns of people who still suffer from poor air quality. The improvement is much less as compared to funds released and utilised in the state under NCAP and other programs for air pollution mitigation efforts. There is much more to be done on this.”
The experience of citizens and medical professionals too on the ground suggests a more complex reality. mid-day spoke with residents across Mumbai, pulmonologists, and air quality experts, many of whom noted a glaring gap between official data and the air they breathe every day. According to the CPCB standards, the permissible level of PM2.5 is 40 µg/m³ annually and 60 µg/m³ for a 24-hour period.
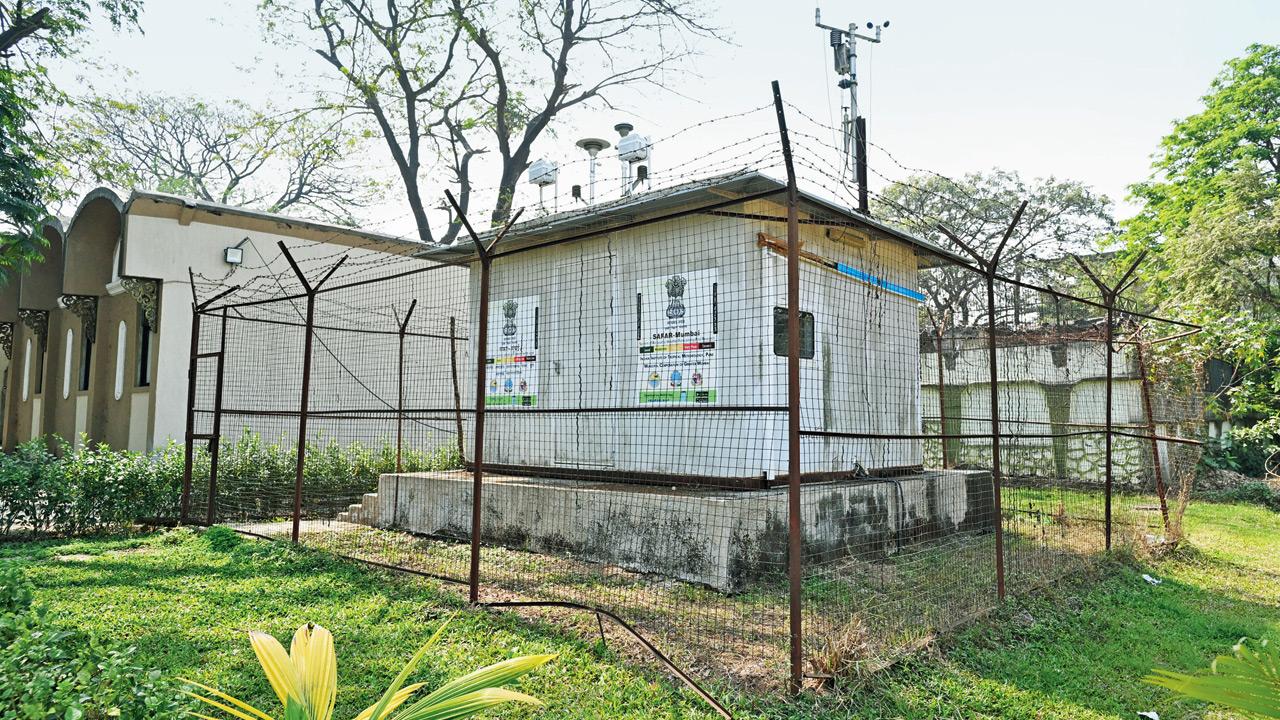
SAFAR air quality monitoring station at Borivli. File Pic/Anurag Ahire
Putting forward views of the citizens Sumaira Abdulali, environmental activist and convenor of NGO Awaaz Foundation, expressed that the process of data monitoring and collation itself appears misleading and confusing, especially from the perspective of a layperson. Many factors contribute to the haze and smog visible in the city, meteorological conditions play a role too, but they are not the sole cause.
“The AQI (Air Quality Index) which is a mixture of several pollutants, may indicate ‘good’ or ‘satisfactory’ levels, but what about PM2.5 levels? Throughout January, PM2.5 levels consistently exceeded CPCB’s 60 µg/m³ limit,” she said. “I feel the AQI itself is somewhat misleading as a metric. It remains ‘good’ until it crosses 100, but that doesn’t necessarily reflect the true air quality, especially when PM2.5—the most damaging to human health—crosses safe limits of 60 µg/m³.”
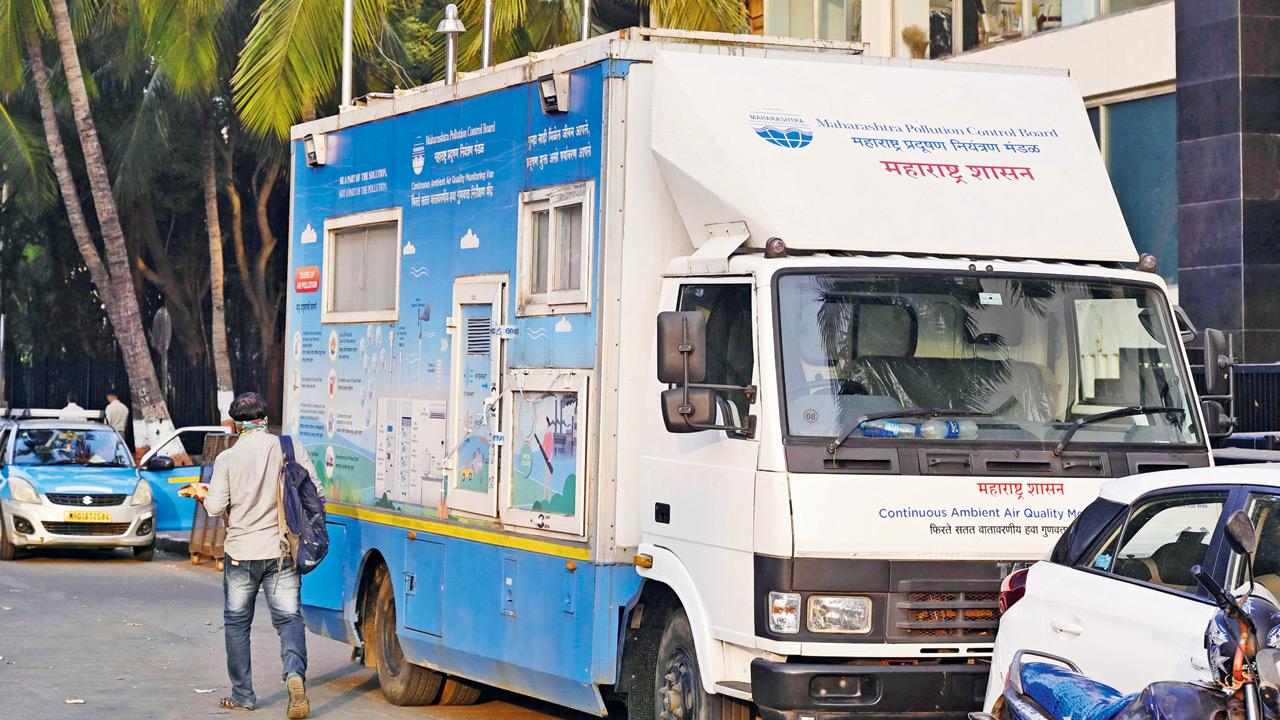 MPCB’s air quality monitoring van at Marine Drive. File Pic/Ashish Raje
She added, “Perhaps this highlights the fact that CPCB’s methods and data gaps create confusion and mislead common citizens.” “While the CPCB data may indicate progress, I still experience eye irritation and breathing discomfort on a regular basis,” says Anita Shetty, a resident of Colaba. “The smoggy mornings and the pollution haze are hard to ignore, especially during the winters.”
Dr Lancelot Pinto, consultant pulmonologist and epidemiologist at P D Hinduja Hospital and Medical Research Centre, told mid-day, “If it is true, it is true… we cannot ignore the data. However, I would be surprised if someone claims that air quality has improved, as that is not my on-ground experience.”
Dr Pinto elaborated, “We continuously see patients who are very sick during winter. People who go outdoors for walks or runs have been experiencing prolonged cough, respiratory discomfort, and upper respiratory tract issues. In fact, this is the third consecutive year that the city has faced particularly poor air quality in winter.”
Dr Pinto also pointed out that while data may suggest improvements in PM2.5 levels, other factors could be contributing to the ongoing air pollution crisis. “If PM2.5 levels are improving, hypothetically, PM10 levels might be rising due to construction activities. A lot still needs to be done for effective mitigation,” he added.
Another pulmonologist from a government hospital in the city echoed these concerns, stating that the number of patients experiencing respiratory distress has remained consistent over the years. “We see a rise in cases of bronchitis and asthma during the winter months. Air quality monitors may report improvements, but clinical data tells another story,” he said.
Further analysis of CPCB data indicates that the improvement in air quality is not homogenous across the city. Certain areas, especially those near construction zones, traffic-dense corridors, and industrial belts, continue to experience high levels of pollutants.
When contacted, an official from Maharashtra Pollution Control Board (MPCB), said, “The monitors record the situation of the vicinity… it’s not something we are just saying. Over the years, the numbers have improved quite a bit. There are also meteorological reasons for the visible haze.” The National Clean Air Programme (NCAP) and the Fifteenth Finance Commission (XV-FC) are both programs in India that aim to improve air quality.
As per data available on Portal for Regulation of Air Pollution in Non-Attainment Cities (PRANA), between 2019-20 and 2023-24, a total of R938.59 crore was sanctioned/released for Mumbai under the two programs of which Rs 574.65 cocre has been utilised so far. Experts have pointed out that the improvement in AQI and reduction in PM2.5 levels are not proportional to the funds allocated for the city’s air pollution mitigation efforts.
Voices
Mohsinkhan Pathan, Waatavaran Foundation
‘We’ve observed a significant drop in pollution levels, thanks to sustained efforts in air quality management, stricter regulations, and growing awareness’
Sumaira Abdulali, Awaaz Foundation
‘The AQI which is a mixture of several pollutants, may indicate ‘good’ or ‘satisfactory’ levels, but what about PM2.5 levels? Throughout January, PM2.5 levels consistently exceeded CPCB’s 60 µg/m³ limit’
Anita Shetty, a Colaba resident
‘While the CPCB data may indicate progress, I still experience eye irritation and breathing discomfort on a regular basis The smoggy mornings and the pollution haze are hard to ignore’
AQI readings for Mumbai on Monday
BKC (MPCB) 102
Borivli East (IITM) 102
Borivli East (MPCB) 63
Byculla (BMC) 67
Chembur (MPCB) 86
Chhatrapati Shivaji
Maharaj Int’l
Airport T2 (MPCB) 84
Colaba (MPCB) 60
Deonar (IITM) 165
Ghatkopar (BMC) 89
Kandivli East (MPCB) 105
Kurla (MPCB) 95
Malad West (IITM) 122
Mindspace,
Malad West (MPCB) 74
Mazagaon (IITM) 119
Mulund West
(MPCB) 71
Powai (MPCB) 101
Sewri (BMC) 66
 Subscribe today by clicking the link and stay updated with the latest news!" Click here!