Evaluating the economic success of this Modi government becoming a tough and almost futile exercise; we look at the movement of money to make sense of growth, instead

India's main stock market index, the BSE Sensex, gave a return of 268% between April 2009 and March 6, 2019, a good portion of which came after April 2014. File Pic
 Narendra Modi was sworn in as prime minister on May 26, 2014. His five years as the prime minister of India are now coming to an end. And given that, a small-scale industry has sprung up, in trying to analyse the economic success of India during the Modi years. Instead of adding to that, in this piece we will try and take a look at how money has moved during the Modi years.
The Foreign Money
Let's start with foreign institutional investors (FIIs), who over the years have invested both in India's stock market as well as debt market. Take a look at Figure 1, which basically plots investments made by FIIs in stocks and debt, over the years.
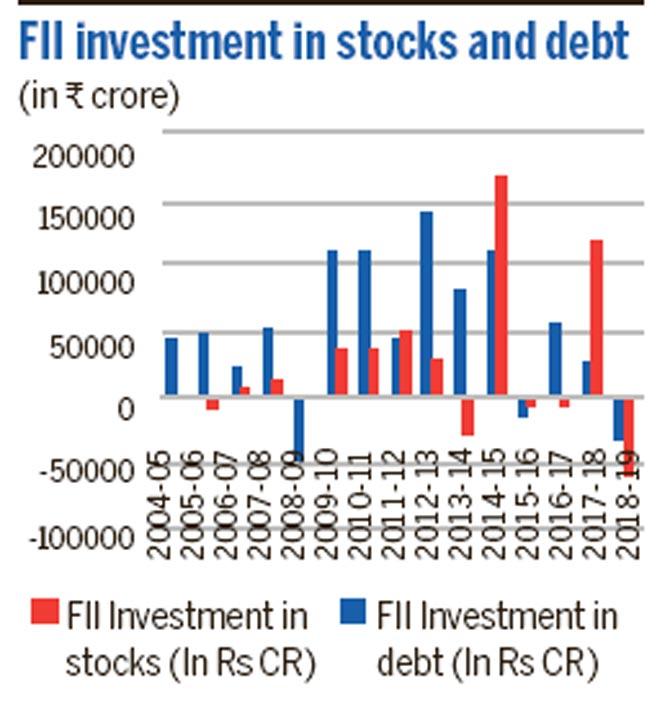
Figure 1:
Figure 1 makes for a very interesting reading. The total FII investment in stocks in between April 2014 and March 6, 2019, a large part of which are the Modi years, stood at R1,47,591 crore. This sounds like quite a lot of money, until we compare it with all the money that FIIs invested in Indian stocks between April 2009 and March 2014, when Manmohan Singh was prime minister. The total investment during that period was R4,83,822 crore.
This basically tells us two things: 1) The FIIs did not buy much into Modi being good for the stock markets story unleashed by the Indian stock brokerages from the second half of 2013. 2) Also, they ended up playing smart. A bulk of their investments were made before 2014, when the Indian stocks were available at low prices in the aftermath of the financial crisis of 2008. This made immense sense. The BSE Sensex, India's main stock market index, has given a return of 268% between April 2009 and March 6, 2019. A good portion of these returns came after April 2014, hence, the FIIs were well placed to benefit from it.
What about the Indian investors?
How have they behaved when it comes to investing in stocks? Let's look at the net investment in equity mutual funds over the years (in Figure 2). This is a good indicator of whether the retail investors are buying stocks or not. Equity mutual funds collect money from investors and then invest that money primarily in stocks.
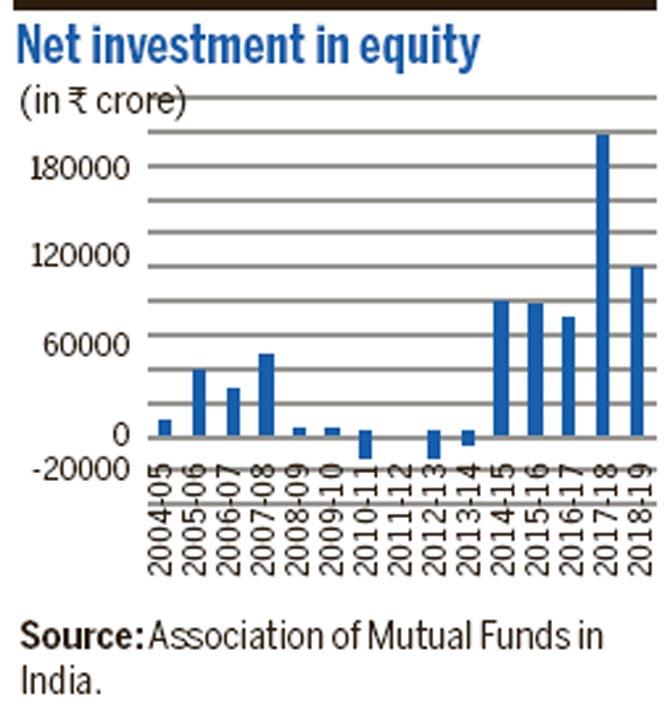
Figure 2:
Figure 2 tells us the retail investors did not invest in stocks between 2009-10 and 2013-2014. During the period retail investors net-sold R33,104 crore worth of equity mutual funds. Of course, this was their response to the stock market collapse in the aftermath of the financial crisis, which broke out in September 2008.
Come 2014, and retail investors bought Modi being good for the stock market story, lock, stock and barrel. Also, by then the BSE Sensex had rallied considerably from its 2008 lows. Between April 2009 and March 2014, the Sensex had gone up by 126%. This gave confidence to retail investors to invest in the stock market. Between April 2014 and January 2019, the net investment in equity mutual funds stood at R4,39,472 crore.
A bulk of this money (R1,56,753 crore) came in 2017-18. This was also on account of interest rates falling in the aftermath of demonetisation which happened in November 2016. Hence, people moved to stocks in search of better returns.
Given this, the Indian retail investor came back to investing in stocks during the Modi years. Nevertheless, the FIIs made more money as always, given that they had invested a bulk of their money before 2014, and have been in the game for a longer period.
Other than the confidence of the foreign investors, how confident were Indians working abroad about the Indian economy? Post 2014-15, there was a dip in inward remittances (Look at Figure 3). In 2016-17 inward remittances by Indians working abroad fell to $35.26 billion, which was just a little more than $34 billion in 2013-14. In the first six months of 2018-19, the inward remittances have been strong at $24.97 billion. Hence, there has been a slight recovery.
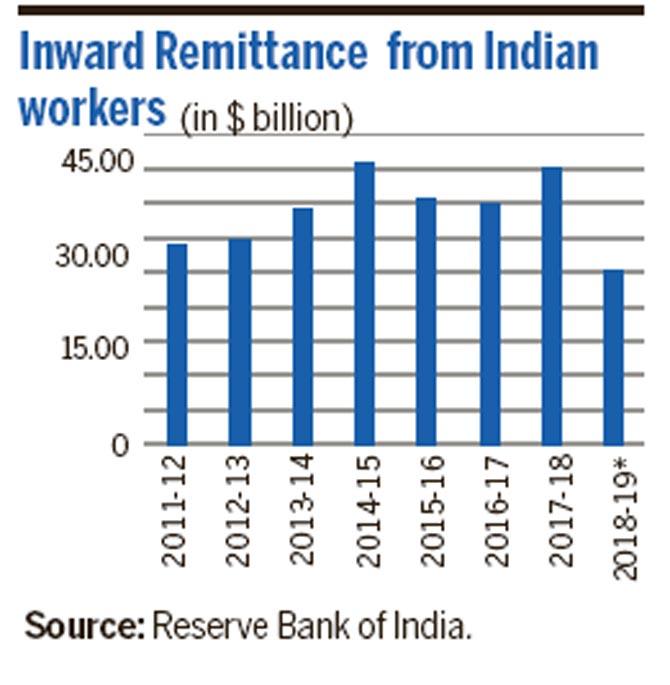
Figure 3:
Looking for safety?
While more Indians have taken to the stock market over the last few years, bank deposits continue to remain the most common form of savings. Take a look at Figure 4, which basically plots the total amount of money held in bank deposits during the course of a year, over the years.
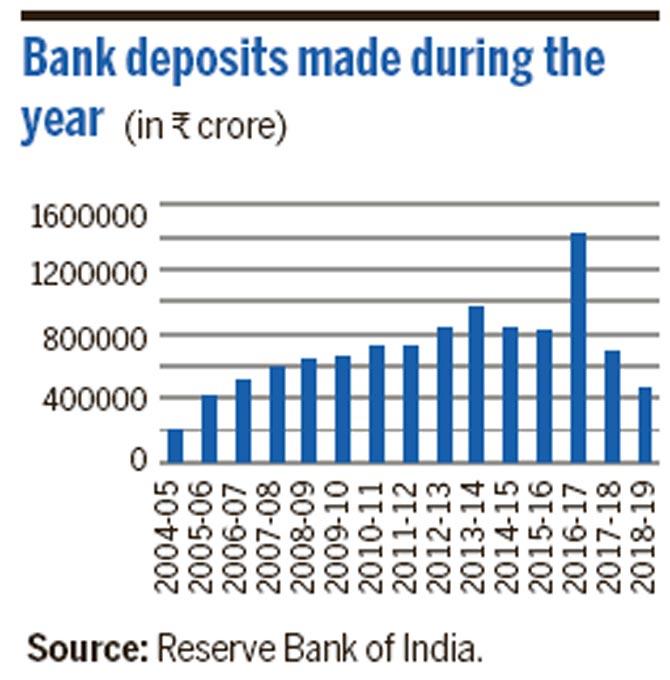
Figure 4:
What does Figure 3 tell us? Bank deposits spiked during 2016-17 primarily because demonetisation forced people to deposit R500 and R1,000 notes with banks. Otherwise, deposits as a form of saving has been falling over the years. In 2013-14, bank deposits worth R9.55 lakh crore were made. This fell to around R6.68 lakh crore in 2017-18, the last year for which full year's data is available.
One reason for this lies in the fact that some portions of the savings have made their way into the stock market since 2014, both in direct and indirect forms. Another reason lies in the fact interest rates on the whole have come down since 2015. This has pushed people to look for other avenues of saving.
One major avenue of investing has been the small savings schemes run by the post office. These include the post office savings account, the public provident fund, senior citizens savings scheme, national savings certificates etc. All the money collected by these schemes is credited into the National Small Savings Fund (NSSF). Figure 5 plots the collections under the NSSF over the years.
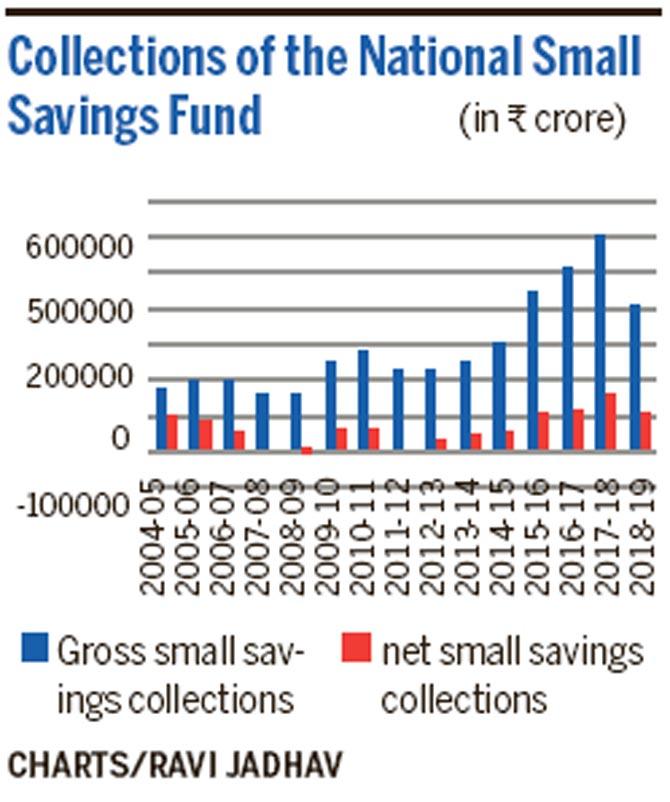
Figure 5:
The gross and the net collections of the NSSF have gone up over the years. The gross collection essentially is the total amount of money coming into these schemes. What remains after the amount withdrawn on maturity by investors is the net collection. The growth in collections of NSSF is on account of the fact that the rate of interest offered on the post office schemes is greater than the interest on offer on bank deposits.
Basically, people have had to look for other avenues of investing after demonetisation ate into the interest they earned on their bank deposits. While, there is no separate data available for Mumbai, given the city's fascination for stocks, it is safe to say that more Mumbaikars have invested in stocks, both directly and indirectly, in the last few years than before.
Also, India's fascination for real estate has come down over the years. In 2011-12, the physical savings in land, real estate etc., amounted to 15.5% of gross national disposable income (GNDI). This has come down to 10.21% of GNDI in 2017-18. This has been on account of real estate barely giving any returns since 2011-12, leading to a lower interest in the sector.
How does the future look? As far as bank interest rates are concerned, they are likely to remain at the current level or even go up slightly, given that banks are almost lending out all the deposits they have.
The real estate sector will continue to remain messy primarily because prices continue to remain high across large parts of the country, including Mumbai. On the stock market front, while the small and midcap stocks have taken a beating, some of the large cap stocks (which constitute the major indices like the Sensex and the Nifty), continue to be expensive.
While there is a great fear of a non-Modi led government knocking out the stock market, it is worth remembering that between April 2004 and March 2014, the BSE Sensex gave an absolute return of 300%. This happened, despite the stock market crashing before, during and in the aftermath of the financial crisis of 2008. Manmohan Singh was the prime minister through much of this period.
Catch up on all the latest Crime, National, International and Hatke news here. Also download the new mid-day Android and iOS apps to get latest updates
 Subscribe today by clicking the link and stay updated with the latest news!" Click here!


